|
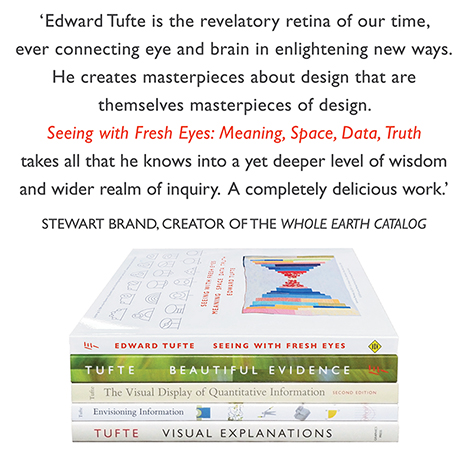
All 5 books, Edward Tufte paperback $180
All 5 clothbound books, autographed by ET $280
Visual Display of Quantitative Information
Envisioning Information
Visual Explanations
Beautiful Evidence
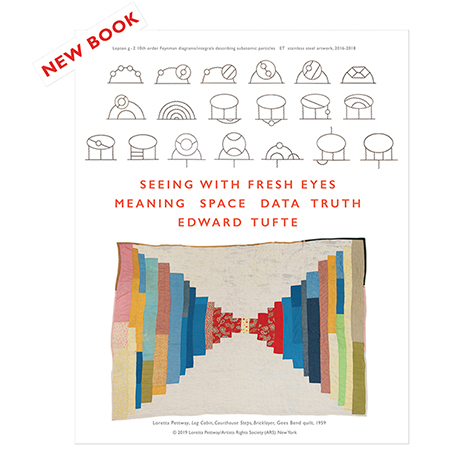
Seeing With Fresh Eyes
catalog + shopping cart
|
Edward Tufte e-books Immediate download to any computer: Visual and Statistical Thinking $5
The Cognitive Style of Powerpoint $5
Seeing Around + Feynman Diagrams $5
Data Analysis for Politics and Policy $9
catalog + shopping cart
New ET Book
Seeing with Fresh Eyes:
catalog + shopping cart
Meaning, Space, Data, Truth |
Analyzing/Presenting Data/Information All 5 books + 4-hour ET online video course, keyed to the 5 books. |
Design review: Improving a good news graphic
The New York Times published an interesting story containing a very good news graphic,
combining a map and a statistical graphic to show that along the East Coast the ocean
is not only rising but also the land is sinking. This leads to a lot of floods,
with a forecast of more and more to come.
Here is my design review suggesting how the map+statistical graphic might be improved,
when done not under deadline and not under the heavy hand of NYTimes style guides.
 |
-- Edward Tufte